Call Analysis turns your Call Insights data into reports that help you understand how calls are being handled and where improvements could be made.
You can use it to understand:
How many calls you receive.
How effectively calls are answered.
When and why calls are being missed.
How Verified Care Enquiries are being handled.
How your performance compares with other nurseries within your group (if applicable).
To get started, open Call Insights in your Portal and select Call Analysis. Choose the time period you want to review. If you manage a group, you can also filter the report by region or individual nurseries.
Overview
The Overview gives you a high-level picture of your call activity.
Headlines
Headlines shows your total number of calls for the selected period and how those calls are categorised, allowing you to quickly understand overall call activity and care enquiry demand.
.png)
Overview - Headlines gives a quick breakdown of total calls and call outcomes.
Summary
Summary shows how your call volumes change over time, making it easier to spot trends and understand whether call volumes are increasing or decreasing.
Verified voicemails that relate to a care enquiry are included in your care enquiry data.
.png)
Overview - Summary shows the share of call types and call volume trends over time.
Call Answering Performance
Use Call Answering Performance to understand how effectively incoming calls are being handled.
Call Answer Rate
Call Answer Rate shows the percentage of calls where the caller speaks to a real person.
Answered calls are calls picked up by your team. Voicemails and missed calls are not counted as answered because there has been no live conversation.
Use this alongside your total call volume to understand whether busy periods or your telephone setup may be affecting your ability to answer calls.
.png)
Call Answer Rate shows answered calls alongside the percentage answered by a staff member.
Average Time to Answer
Average Time to Answer measures the time between the phone starting to ring and the caller speaking to a member of your team.
Reviewing this alongside call volumes helps you understand the experience callers have when trying to reach you and whether response times change during busy periods.
.png)
Average Time to Answer shows how long callers wait before speaking to a member of your team.
Missed and Unanswered Calls
This report breaks missed and unanswered calls down by reason, helping you understand why callers may not be reaching your team.
Reasons can include:
Callers hanging up during the phone menu (IVR).
Lines being busy.
Calls not being answered.
This can help you identify whether changes are needed to staffing, call handling or your telephone setup.
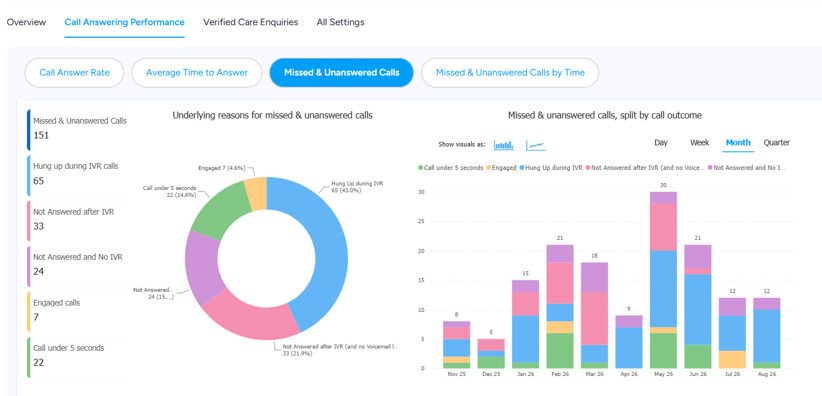
Missed and Unanswered Calls highlights the underlying reasons calls are not connecting.
Missed and Unanswered Calls by Time
See which days of the week and times of day you miss the most calls.
Use this information to identify busy periods and plan your staffing so you have the right cover when demand is highest.
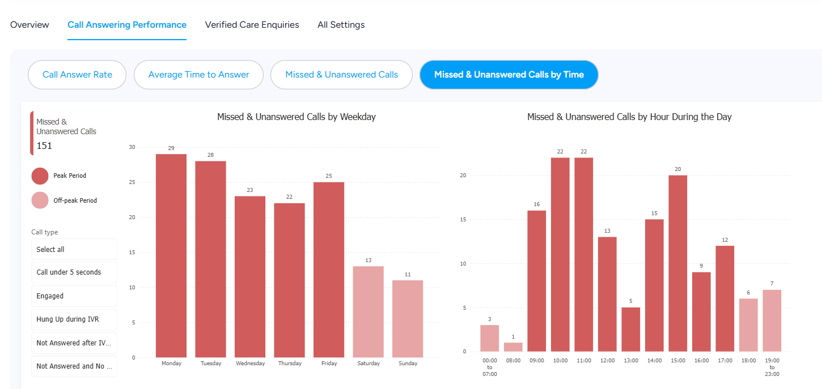
Missed and Unanswered Calls by Time helps identify the busiest days and hours.
Verified Care Enquiries
The Verified Care Enquiries section focuses specifically on calls from potential residents, families and professionals looking for care.
Care Enquiry Volumes
See the total number of care enquiry calls by month his helps you understand the types of enquiries you receive and what time of year demand is at it’s highest and lowest points.
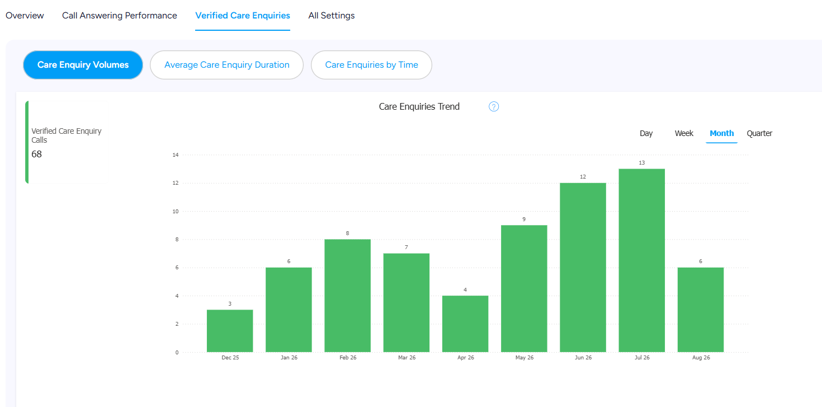
Care Enquiry Volumes shows care enquiry trends.
Average Care Enquiry Duration
See the number of care enquiry calls alongside their average duration.
Call duration can provide useful context when looking at how enquiries are being handled. Longer calls may indicate more detailed conversations, while very short calls could highlight incomplete conversations or missed opportunities.
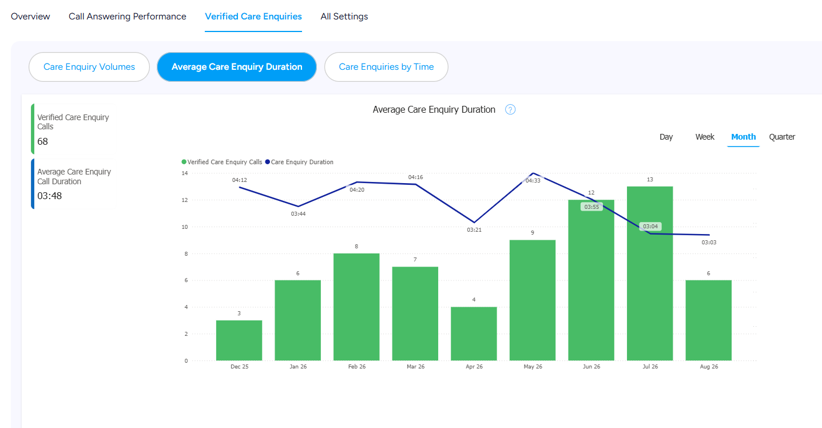
Average Care Enquiry Duration compares enquiry volumes with average call length.
Care Enquiries by Time
See which days of the week and times of day generate the most care enquiries.
This can help you make sure the right staff are available when care enquiry demand is highest.
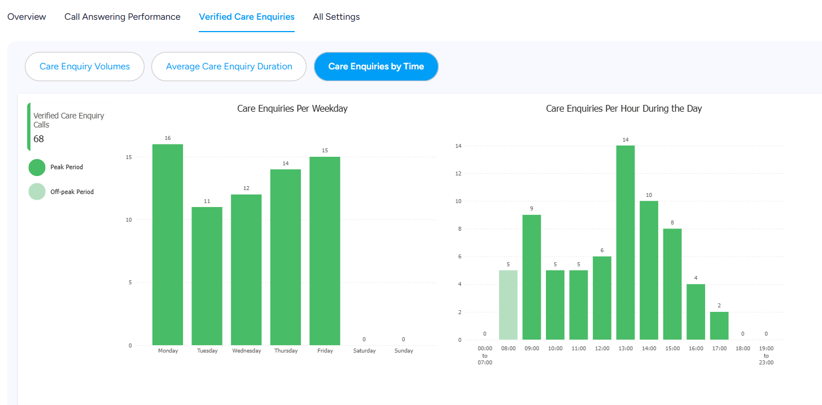
Care Enquiries by Time shows when care placement enquiry demand is highest.
Group reporting and filters
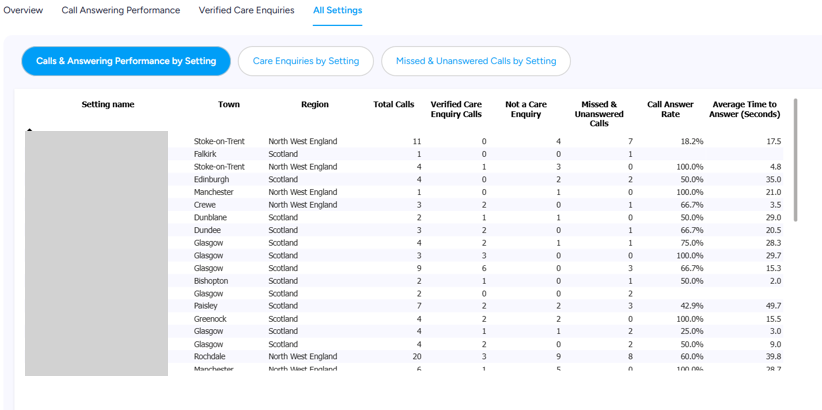
If you manage a group, you can use All Settings and the available filters to focus on particular homes or regions in a tabled format rather than the available graphs on the previous tabs.
This gives you a group-level view of performance and makes it easier to identify where individual settings may need additional support or where good practice could be shared across the group.
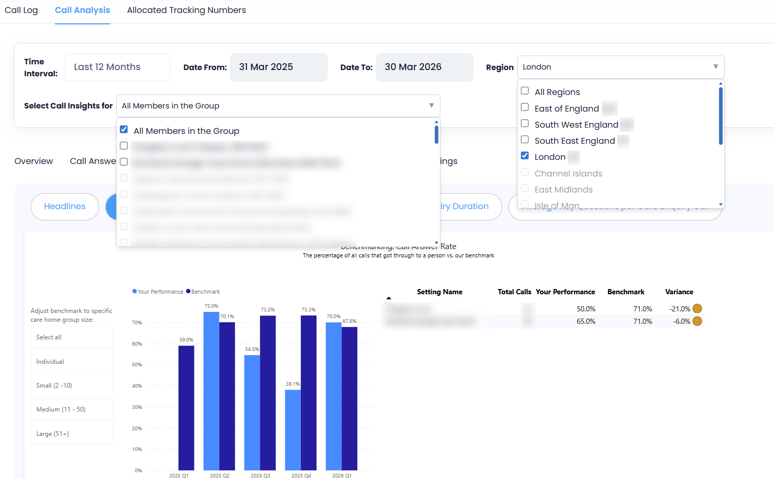
Group filters let you focus Call Analysis on particular regions or nurseries.
Group filters let you focus Call Analysis on particular regions or nurseries.
Together, the Call Analysis reports help you see what is happening with your calls, understand what is driving your results and identify where you can make improvements.